Mastering CAN Bus Monitoring with CANopenTerm: A Step-by-Step Guide
Introduction
If you work with CANopen CC networks or any CAN-based system, monitoring traffic on the wire is essential for debugging and analysis. CANopenTerm, a terminal-driven tool by Michael Fitzmayer, offers a fast, scriptable, and lightweight alternative to heavy GUI tools. This guide walks you through installing, configuring, and using CANopenTerm to sniff raw frames, trace messages, probe nodes, and extend its capabilities with Lua or Python scripting. Whether you're a seasoned CAN engineer or just getting started, these steps will help you harness the power of console-based CAN monitoring. For prerequisites, see the What You Need section.

What You Need
- A computer running Linux (recommended) or another Unix-like OS
- A CAN interface (e.g., USB-to-CAN adapter, SocketCAN compatible)
- CANopenTerm source code (available from the project repository)
- Basic familiarity with the command line
- Optional: Lua or Python interpreter for advanced scripting
Step-by-Step Guide
-
Step 1: Install CANopenTerm
Clone or download the CANopenTerm repository. The tool is built with standard C libraries and requires
libcanor SocketCAN support. Compile usingmakeand install to a directory in your PATH. Verify installation by runningcanopenterm --help. -
Step 2: Connect Your CAN Hardware
Attach your CAN interface (e.g., USBtin, PCAN, or built-in CAN controller) to the system. Load the appropriate kernel module (e.g.,
can,can-raw,vcanfor virtual testing). Bring the interface up withip link set can0 up type can bitrate 250000or your network's bitrate. -
Step 3: Launch CANopenTerm
Start the tool with
canopenterm -i can0(replacecan0with your interface). By default, it opens in interactive mode, displaying live CAN frames in the terminal. Use the-rflag to log raw data to a file. -
Step 4: Sniff Raw Frames
Once running, CANopenTerm shows every frame on the bus in real-time. Each line includes the CAN ID, data length (DLC), and payload bytes. Press Ctrl+C to pause output, and use arrow keys to scroll through history. This is the foundation for all further analysis.
-
Step 5: Probe CANopen Nodes
Use the built-in probing feature to discover and query nodes on the network. Type
probeat the prompt to send a Node Guarding or NMT request. The tool lists all responding nodes with their IDs and status. For deeper diagnostics, useprobe --sdoto read object dictionary entries. -
Step 6: Trace Specific Messages
Filter frames by CAN ID or data pattern using the
tracecommand. For example,trace 0x201shows only frames with that identifier. Combine with--continuousto follow a sequence. The trace function isolates important signals without clutter.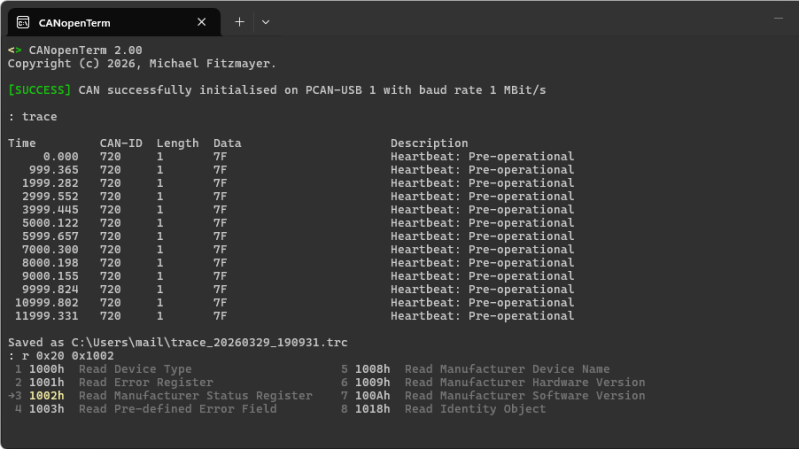
Source: hackaday.com -
Step 7: Add Scripting with Lua or Python
CANopenTerm supports external scripting to automate tasks or parse complex protocols. Create a Lua script (e.g.,
filter.lua) that hooks into frame events, then load it with--script filter.lua. Python works similarly with--py-script. Scripts can generate custom alerts, log selected data, or trigger actions based on CAN IDs. -
Step 8: Perform Protocol-Aware Inspection
For CANopen-specific networks, enable protocol-aware mode with
--canopen. The tool automatically decodes PDOs, SDOs, and SYNC messages. Useshow --pdoto view process data objects mapped to nodes. This feature turns raw bytes into meaningful device values, speeding up debugging. -
Step 9: Save and Analyze Logs
Output can be redirected to a file using shell redirection:
canopenterm -i can0 > log.txt. Later, replay logs withcanplayer(if using SocketCAN) or load into tools like Wireshark. For offline analysis, use CANopenTerm's--playbackmode to step through recorded traffic.
Tips for Success
- Start with virtual CAN – Use
modprobe vcanandip link add vcan0 type vcanto practice without physical hardware. - Keep it simple – Resist overcomplicating scripts initially. A few lines of Lua to filter high-priority IDs can save hours.
- Master the help menu – Type
helpinside CANopenTerm for a full list of commands and flags. The tool is terminal-centric; keyboard shortcuts boost speed. - Combine with other tools – Pair CANopenTerm with
candumpfor background logging orcan-utilsfor offline analysis. See our earlier guide for more CAN visualization tools. - Test with known traffic – Before probing a live system, simulate typical frames with
cangento verify your setup. - Stay up-to-date – Check the project repository for updates; newer versions may improve protocol support and scripting APIs.